

 Română
 English

Test a KPI scorecard before launch by calculating it on 3–6 past months, without communicating the results: check how the scores are spread across the levels, how much the results move when you change the weights, how much each indicator really counts and how many scores come out without data. The article gives you an example calculated on eight people, a way of seeing each indicator’s “effective” weight, written “ready to launch” criteria and an Excel file with which you can redo the simulation on your own data.
Quick answer. A KPI scorecard is tested by simulation on historical data: apply the formula to the last 3–6 months, look at the spread of scores across the levels, compare the ranking obtained with two sets of weights and count the scores without data. Launch the scorecard only when the spread is plausible, no part dominates unintentionally and every odd case has an explanation.
What testing a KPI scorecard means
The KPI scorecard is the set of indicators for a role, with the weights, caps, rules for missing data and the levels that turn the figures into a score. Choosing the indicators is the subject of the guide on how to choose KPI indicators. Here the scorecard already exists; the question is whether it produces scores you can trust.
- Retroactive simulation means applying the new scorecard to periods already closed, without the results counting for anyone. In modelling, the procedure is called backtesting.
- Sensitivity analysis measures how much the scores and the ranking change when you alter one choice: a weight, a cap, a level threshold.
- The spread of scores shows how many people land on each level and how far apart the scores are (minimum, median, maximum, standard deviation).
- The nominal weight is the percentage written in the scorecard. The effective weight is how much an indicator actually contributes to the differences between people. The two can be very different.
- The pilot means using the scorecard for 1–2 months alongside the old system, with results shown to people but with no effect on the bonus or the appraisal.
Why checking the formula is not enough
A formula can be mathematically correct and still produce useless scores. The problems appear only when the formula meets the real data of a whole month. Four situations show up only in a simulation.
- One indicator dominates. The indicator with the widest spread of values decides the ranking, even if its written weight is not the largest.
- Everyone lands on the same level. The level thresholds are too wide for how much the scores vary, and the scorecard no longer tells anyone apart.
- The cap catches too many people. If half the team sits at the cap on an indicator, the indicator no longer differentiates above the target.
- Data are missing systematically. A source that does not arrive in time for a whole unit turns a data problem into a difference in score.
The OECD and European Commission Joint Research Centre handbook on composite indicators says the same for statistical indicators: weights can have a significant effect on the result and on the ranking, and robustness is checked through uncertainty and sensitivity analysis. A KPI scorecard is, technically, a composite indicator for a single person.
What data you need for the simulation
Use the real values of the indicators for the last 3–6 closed months, for everyone the scorecard will apply to. A single month is not enough: an exceptional month often corrects itself the following month (the phenomenon is called regression to the mean), and a scorecard tested on it would be tuned to an exception.
| Data problem | How it shows in the simulation | What you do before launch |
|---|---|---|
| A source that runs late (a report loaded after the close) | Many scores calculated from fewer parts than the rest | Set the date by which the data are loaded and who is responsible for it |
| A different definition between units (for example, sales with or without returns) | A whole unit far above or below the others | Unify the definition and recalculate the test months |
| People hired or leaving during the period | Extreme scores for people with few days worked | Write the rule for incomplete months (a pro rata target or “no data”) |
| An indicator with no variation (everyone has 100) | The part changes nothing in the ranking | Take it out of the weighting or change the scoring method |
A worked example: eight people, two sets of weights
Hypothetical example. Fictitious data for eight sales assistants in a chain of stores. The scorecard has three parts: Sales (% of plan, capped at 120), Quality (the service audit score, 0–100) and the Manager’s evaluation (% of the evaluation form’s points). Levels: below 85 “Needs improvement”, from 85 “Good”, from 100 “Excellent”. The score is the weighted average of the parts with data; a part without data is left out, and the others take over its weight.
Option A sets the weights at 50% / 30% / 20%. Option B moves 10 points from sales to the evaluation: 40% / 30% / 30%. Horia has no evaluation in the month, so his score is calculated from two parts.
| Employee | Sales (after the cap) | Quality | Evaluation | Score A | Level A | Rank A | Score B | Level B | Rank B |
|---|---|---|---|---|---|---|---|---|---|
| Ana | 118 | 84 | 76 | 99.40 | Good | 2 | 95.20 | Good | 2 |
| Bogdan | 104 | 96 | 100 | 100.80 | Excellent | 1 | 100.40 | Excellent | 1 |
| Cristina | 120 (actual 132) | 72 | 64 | 94.40 | Good | 4 | 88.80 | Good | 6 |
| Dan | 81 | 86 | 88 | 83.90 | Needs improvement | 8 | 84.60 | Needs improvement | 8 |
| Elena | 99 | 90 | 86 | 93.70 | Good | 5 | 92.40 | Good | 4 |
| Florin | 72 | 98 | 96 | 84.60 | Needs improvement | 7 | 87.00 | Good | 7 |
| Gabriela | 111 | 88 | 80 | 97.90 | Good | 3 | 94.80 | Good | 3 |
| Horia | 90 | 92 | no data | 90.75 | Good | 6 | 90.86 | Good | 5 |
Every score can be redone. Ana, option A: 118 × 0.5 + 84 × 0.3 + 76 × 0.2 = 59 + 25.2 + 15.2 = 99.40. Horia, option A: (90 × 0.5 + 92 × 0.3) ÷ 0.8 = 72.6 ÷ 0.8 = 90.75. The same Horia, option B: (36 + 27.6) ÷ 0.7 = 90.86.
What the example shows
- A level changes. Florin moves from “Needs improvement” (84.60) to “Good” (87.00) only because 10 points of weight were moved. If the level decides a bonus, the decision about the weights is a decision about Florin’s money.
- The ranking moves in the middle. Cristina drops from 4th to 6th place; Elena and Horia each go up one place. The first and the last stay where they are.
- The spread narrows. Option A gives a minimum of 83.90, a median of 94.05, a maximum of 100.80 and a standard deviation of 5.98. Option B gives 84.60, 91.63, 100.40 and 4.74. With B, six people out of eight are “Good”.
Nominal weight and effective weight
An indicator influences the ranking according to its weight and how much the values differ between people. A simple estimate is the weight multiplied by the indicator’s standard deviation, divided by the sum of these products. The estimate ignores correlations between indicators, so use it as a signal, not as an exact measurement.
| Part | Standard deviation (after the cap) | Nominal weight A | Estimated effective weight A | Nominal weight B | Estimated effective weight B |
|---|---|---|---|---|---|
| Sales | 16.22 | 50% | 64.1% | 40% | 53.3% |
| Quality | 7.58 | 30% | 18.0% | 30% | 18.7% |
| Evaluation | 11.34 | 20% | 17.9% | 30% | 28.0% |
In option A, sales have half the weight but explain almost two thirds of the differences between people. Quality has 30% on paper, but contributes about 18%, because almost everyone has similar scores. If the intention was for the scorecard to reward quality, the simulation shows that it does not.
The calculation for sales, option A: 0.5 × 16.22 = 8.110; quality 0.3 × 7.58 = 2.274; evaluation 0.2 × 11.34 = 2.268; the sum 12.652; 8.110 ÷ 12.652 = 64.1%.
Remember. The weight written in the scorecard says what you want to count. The simulation says what actually counts. An indicator with similar values for everyone has little influence, however large its weight.
How to read the spread of scores
There is no universally “correct” spread. A carefully selected team can legitimately have many people at “Good”. The spread must, however, be plausible to someone who knows the team, and it must be explainable.
| What you see | What it usually means | What you check |
|---|---|---|
| Everyone on the same level | The thresholds are too wide for the variation in scores | The level thresholds, compared with the simulation’s minimum and maximum |
| Most below expectations | Unrealistic targets or a wrong data source | The targets on past months and the indicators’ definitions |
| A group separate from the rest (for example, a unit) | Different conditions or different definitions between units | Whether the targets need to differ by location |
| Many people at the cap on the same part | The target is too low or the cap too small | How many reach the cap in each test month |
| Many scores “without a score” or from fewer parts | A data collection problem | Who loads the data and by when |
For different targets by location, read the article on KPI targets for different locations. For the missing-data rule at process level, the article on missing data in performance evaluation.
The “ready to launch” criteria
Write the criteria before the simulation, so you do not fit them to the result. A starting list, to be adapted:
- Every indicator has a definition, a source, someone responsible for the data and a rule for when it is missing.
- The weights add up to 100%, and the estimated effective weight of each part differs from the nominal one by no more than you have decided to accept (for example, 10 percentage points).
- In each test month, at most a percentage set in advance (for example, 5%) of the scores comes from fewer parts than the rest.
- No part has more than a quarter of the people at the cap, consistently, in every month.
- The spread across levels is considered plausible by the managers who know the team, and every disputed case has a written explanation.
- A small change of weight (5–10 points) moves no more than a few people from one level to another; if it does, you know why.
- A full example of the calculation is ready for communicating to people.
The thresholds in the list (10 points, 5%, a quarter) are management choices, not standards. What matters is to fix them before the test.
The steps of the pilot
- Fix the test version. Note the weights, caps, levels and the rule for missing data. Any later change becomes another version.
- Gather the data. The last 3–6 closed months, for the scorecard’s whole population, from the sources that will also be used after launch.
- Run the base simulation. Note for each month: how many have a score, how many do not, the minimum, median, maximum and the spread across levels.
- Test the sensitivity. Move 5–10 points of weight between parts, change the cap and the thresholds, one choice at a time. Note who changes level.
- Calculate the effective weight and compare it with the intention. Correct it if a part dominates without your having wanted that.
- Discuss the odd cases with the managers: a good person with a low score, a month with a lot of missing data, a unit separate from the rest. Each gets an explanation or a correction.
- Run the pilot for 1–2 months in parallel, with the scores shown to people and no financial effect. Collect their questions.
- Check the launch criteria, publish the final version and communicate it with an example of the calculation before the first month that counts.
Caution. Romania’s Labour Code gives the employer the right to set individual performance objectives and the evaluation criteria (art. 40(1)(f)), and the internal regulations must contain the criteria and procedures for professional evaluation (art. 242(i)). Testing itself is a management recommendation. If the score affects pay or the bonus, check with the company’s lawyer how the scorecard is documented and communicated before it is applied.
Common mistakes
- The test on a single month. Correct it: use 3–6 months, so that an atypical month does not tune the scorecard.
- The “ready” criteria written after the result. Correct it: fix them before the first simulation.
- Several changes at once. If you change the weights and the thresholds at the same time, you no longer know what produced the effect. Correct it: one choice at a time.
- The nominal weight taken as the real influence. Correct it: estimate the effective weight and discuss the difference.
- Tuning the scorecard until the “good people” come out on top. The scorecard becomes a confirmation of impressions, not a measurement. Correct it: change the scorecard only for reasons you can write down (a wrong target, an inconsistent definition).
- Missing data ignored in the test. Correct it: count the scores calculated from fewer parts and fix the source before launch.
- A pilot with a financial effect. Correct it: the pilot does not decide money; otherwise people negotiate the scorecard rather than test it.
How to run the test in Harmoniq
In Harmoniq, the KPI scorecard is simply called a scorecard. On the scorecard’s page, the “Dry run” card calculates the scorecard on a closed period chosen from the list, without saving anything. The result shows how many are assessed, how many are left without a score, the minimum, the median, the maximum, the total of the bonuses, how many components had no data, the histogram of scores and the split across levels.
- Try it before publishing. A draft can be run on a past period; until it is published, nothing is calculated for anyone. For sensitivity, change the weights in the draft (“Importance”) and run the dry run again on the same period.
- Individual cases. The dry run shows the spread, not the list of people. For a particular person, the “Try it” panel in the builder shows the result of one part on a real example; for comparing rankings, use the file below.
- Versions. A published scorecard is frozen; a change becomes the next version, and results already calculated stay tied to their version.
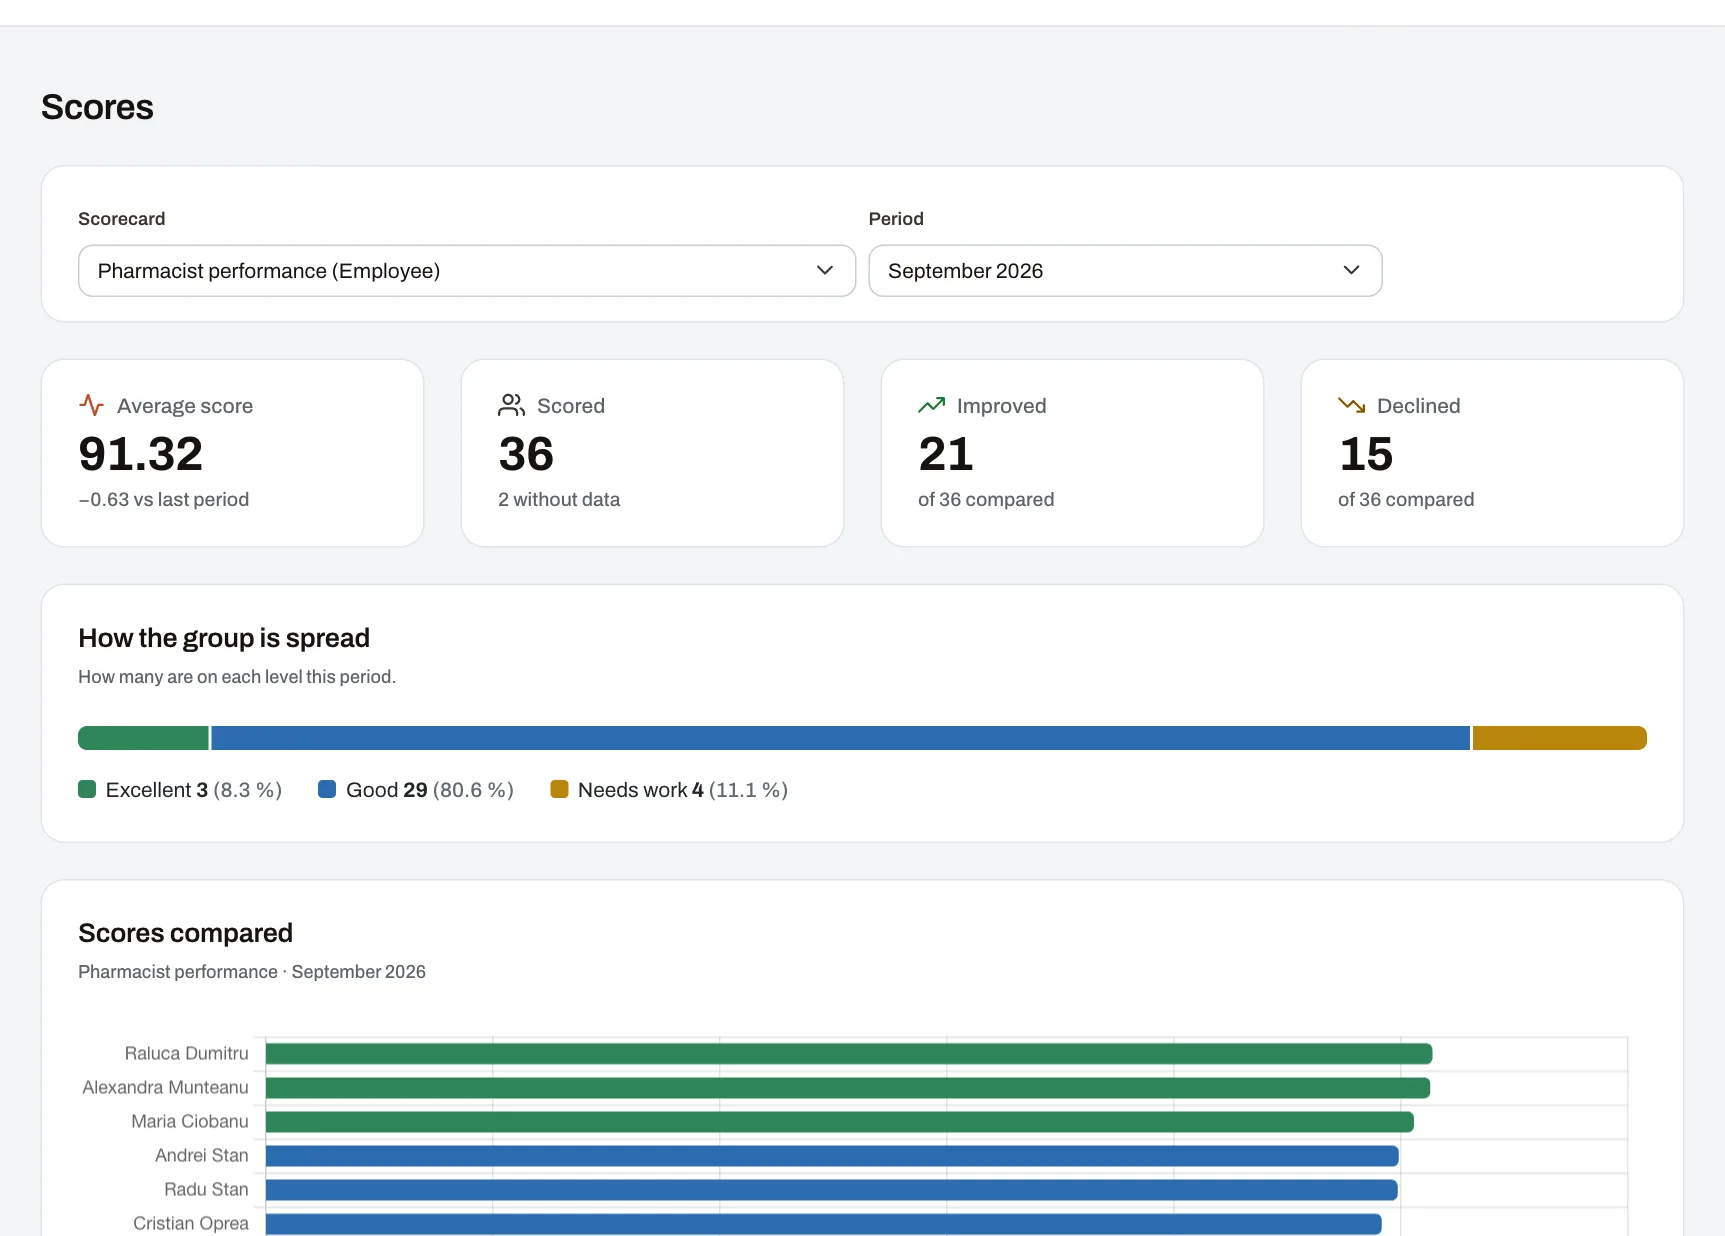
- After launch, the “Scores” page shows, for each closed period, how the group is spread across the levels and how many were left without data.
Building your own scorecards and the dry run are included in the Professional and Enterprise plans.
The simulation file
The file simulare-ponderi-si-scoruri.xlsx (in Romanian) contains the example above, with formulas. Fill in the people’s values on the “Date” (data) sheet and two sets of weights on the “Ponderi” (weights) sheet; the “Simulare” (simulation) and “Rezumat” (summary) sheets calculate the scores, levels, ranks, rank changes, the spread and the estimated effective weight. The coloured cells are the ones you fill in.
Frequently asked questions
How many months of data do you need to simulate a KPI scorecard?
Use at least three closed months and, if the business is seasonal, six or more. A single month can be atypical: a campaign, a stock shortage, a long leave. Over several months you see whether the spread is stable and whether the same people consistently come out on top or at the bottom, which says more than a snapshot of a single month.
What do I do if an indicator has no history?
Simulate the scorecard without it and add it with zero weight for the first months, for information only. After 2–3 months of real data you see how the values vary, and only then do you give it a weight. Alternatively, use a provisional target and tell people explicitly that the part is on trial and does not yet affect the result.
How much can the ranking change when I change the weights?
It depends on how much people differ from one another on each indicator. In the article’s example, moving 10 points of weight changes the rank of three people and the level of one. If a small change moves many people from one level to another, the scores are close to the thresholds, and the scorecard must be communicated with care, especially when the level decides a bonus.
What is an indicator’s effective weight?
The effective weight shows how much an indicator contributes to the differences between people’s scores, not just what the scorecard says. An indicator with widely spread values has a large influence even with a moderate weight, and one where everyone has similar values counts for little. The weight × standard deviation estimate ignores correlations, so it serves as a check signal, not an exact value.
Do I have to show employees the simulation results?
You do not need to show the individual scores from the simulation, because they counted for nobody. It is useful to show the final scorecard, a full example of the calculation and, possibly, the anonymous spread across levels. The pilot, by contrast, is run with scores shown to people, so that you learn early what they do not understand and what they dispute.
Who should take part in testing the scorecard?
Whoever builds the scorecard (usually HR or management control), the managers who know the people being assessed and whoever holds the data sources. The managers check whether the spread is plausible, and those responsible for the data explain the odd values. The people assessed do not have to validate the scorecard, but their questions during the pilot show what needs explaining better.
Does the simulation guarantee that the scorecard is right?
No, the simulation only shows how the scorecard behaves on past data. It cannot say whether the chosen indicators measure what matters for the role, nor how people will change their behaviour once they learn the rules. That is why, after launch, you review the scorecard after the first three real months and watch for unwanted effects.
What to do next
Download the simulation file, replace the fictitious data with the last three months of a single role and write down the launch criteria before you look at the result. If the score will decide money, continue with the article on thresholds, accelerators and caps on bonuses. For the behaviours a scorecard can wrongly encourage, read KPIs that encourage the wrong behaviour. To see scorecards and scores on fictitious data, enter the demo company.