

 Română
 English
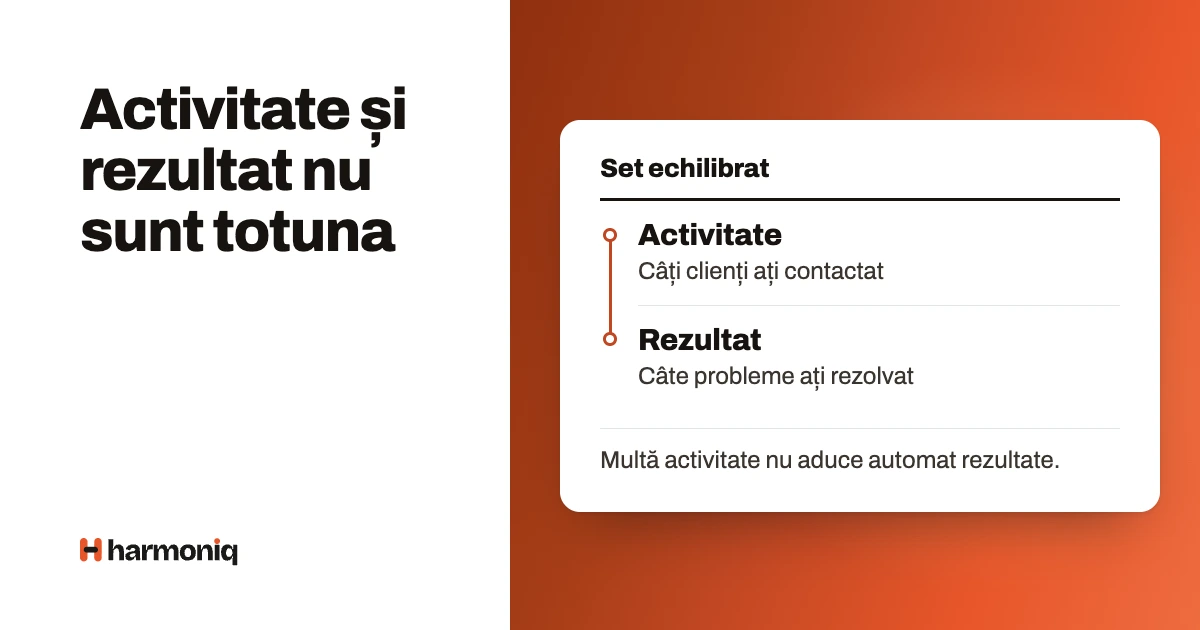
A result indicator (lagging) shows what has already been achieved: sales, transactions, accidents, people leaving the company. A leading indicator moves ahead of the result and can predict it: viewings, offers sent, hazards reported and fixed. An activity indicator counts the effort put in and becomes a leading indicator only if the data show that it predicts the result.
The article gives examples for six roles, a check on fictitious data that shows when an activity predicts the result and when it does not, and a simple rule for a balanced set: every important result has one or two verified leading indicators.
Quick answer. Result (lagging) indicators measure what has already happened and show whether you reached the objective. Leading indicators measure things that happen beforehand and allow you to correct course in time. A balanced set has, for every important result, one or two leading indicators verified on historical data, plus a quality indicator that prevents shortcuts.
Definitions: activity, leading, result
The result indicator (lagging indicator) is a measure of the final effect of the work, visible once the period has ended: net sales, transactions closed, staff turnover, the number of accidents. It confirms whether the objective was reached, but it comes too late for corrections in the same period.
The leading indicator is a measure that moves ahead of the result and, on the company’s data, predicts it: viewings scheduled, offers sent, the time taken to fix a reported hazard. OSHA’s guide on workplace safety describes them as “proactive, preventive and predictive” measures, while result indicators measure events that have already happened, such as the injury rate (OSHA 3970, June 2019).
The activity indicator consists of counting effort: calls, visits, emails, hours of training. Activity is a condition of the result, not a guarantee of it. An activity indicator becomes a leading indicator only when the data show that its movement is followed by a movement in the result.
How they differ, in a table
| Kind | What it shows | When it is visible | Who can move it directly | The main risk |
|---|---|---|---|---|
| Activity | How much effort was put in | Daily, immediately | The person, almost entirely | Visible effort without results; inflated counts |
| Leading | Whether the result is on track | Weekly or monthly, ahead of the result | The person and the team, partly | The link with the result may be assumed, not proven |
| Result | What was achieved | At the end of the period or later | Several factors, including external ones | The correction comes too late; luck weighs heavily over short periods |
Remember. The kind depends on the level. The time to fill a position is a result indicator for the recruiter and a leading one for the store manager, who knows that an unfilled position will spoil next month’s shift rota.
Examples for six roles
Fictitious examples, to be adapted. The middle column holds candidate leading indicators: each must be verified on the company’s data before it is used.
| Role | Activity | Leading (to be verified) | Result |
|---|---|---|---|
| Estate agent | Calls to owners | Viewings carried out; exclusive agreements signed | Transactions closed, commission collected |
| Sales assistant in a store | Customers approached | Conversion rate; items per transaction | Net sales, margin |
| Hotel receptionist | Pre-registrations sent | Check-in under 5 minutes; special requests resolved before arrival | The review score, returning guests |
| Pharmacist | Counselling given when dispensing | The score at the internal check of counselling | Justified complaints, returning patients |
| Recruitment specialist | Candidates contacted | Candidates past the first interview; time to offer | Hires still there after 90 days |
| Health and safety officer | Inspections carried out | The time taken to fix reported hazards | Accidents and incidents recorded |
OSHA gives exactly this kind of example: the response time to a reported hazard. The guide says a good programme uses leading indicators to drive change and result indicators to measure effectiveness.
How to check whether an indicator really predicts the result
A leading indicator is not declared; it is verified. Put side by side, month by month, the indicator’s values and the result in the following period, and see whether the ratio between them is stable.
Hypothetical example. Two estate agents, six months, fictitious data. For each month: the viewings carried out and the transactions closed in the following month.
| Month | Agent A: viewings | Agent A: transactions the following month | Agent A: ratio | Agent B: viewings | Agent B: transactions the following month | Agent B: ratio |
|---|---|---|---|---|---|---|
| 1 | 40 | 3 | 7.5% | 45 | 1 | 2.2% |
| 2 | 52 | 4 | 7.7% | 50 | 4 | 8.0% |
| 3 | 35 | 3 | 8.6% | 38 | 2 | 5.3% |
| 4 | 60 | 5 | 8.3% | 55 | 1 | 1.8% |
| 5 | 48 | 4 | 8.3% | 42 | 3 | 7.1% |
| 6 | 30 | 2 | 6.7% | 47 | 0 | 0.0% |
| Total | 265 | 21 | 7.92% | 277 | 11 | 3.97% |
For agent A, the ratio stays between 6.7% and 8.6%: more viewings were followed by more transactions. The correlation coefficient calculated over the six months is 0.98. For agent B, the ratio jumps between 0% and 8%, and the correlation is −0.13: his viewings say nothing about the following month’s transactions.
The practical conclusion differs. For A, viewings are a useful leading indicator, and a month with few viewings deserves an immediate conversation. For B, the problem is not the number of viewings but what happens after them: qualifying buyers or matching properties. A later-stage indicator, for example the offers received after a viewing, may be more useful. Stage-by-stage conversion is calculated in the article on evaluating estate agents.
Caution. Six months and two people are too little data for a firm conclusion; the example shows the method, not a rule. A strong correlation does not prove that the activity produces the result: both may depend on a third factor, for example the season. Check across more people and more months, and watch whether the link holds once the indicator starts to count in the evaluation.
How to build a balanced set
The idea of putting financial indicators side by side with indicators that anticipate them is not new. The balanced scorecard, proposed by Robert Kaplan and David Norton in the Harvard Business Review in 1992, adds three perspectives to the financial measures: customers, internal processes, and learning and growth (Kaplan and Norton, “The Balanced Scorecard — Measures that Drive Performance”, 1992). For a single role, the set is built more simply.
- Start from the result. Write down one or two results the role exists for, with their indicator. The details of choosing them are in the guide to KPI indicators.
- Draw the path to the result. For each result, write down the stages that precede it: for a property transaction, exclusive agreement → viewing → offer → contract.
- Choose leading candidates from the intermediate stages, not from raw effort. “Offers received” says more than “calls made”.
- Check each candidate on historical data, as in the example above. Keep only those whose link with the result is visible.
- Add a quality indicator next to each countable leading indicator: viewings with qualified buyers, not just any viewing.
- Decide the role of each: which indicator goes into the score and which is tracked only for discussion. Activity indicators usually belong in the second group.
- Review the set after three to six months: a link that weakens once the indicator has become a target is a sign that the figure is being gamed.
Practical tip. Use leading indicators in the weekly conversations and result indicators in the end-of-period evaluation. That way the conversation about what is to be done that week has a figure that can still change by Friday, and the evaluation rests on what was achieved.
Common mistakes
- Activity put in place of the result. “40 calls a day” becomes an end in itself, and the calls get shorter. Correct it: track the activity, evaluate the result. The mechanism is described in the article on KPIs that encourage the wrong behaviour.
- A leading indicator declared, not verified. Correct it: put the data side by side, as in the agents’ table, before you use it.
- Result indicators only. Problems show up at the end of the quarter, when they can no longer be corrected. Correct it: one or two leading indicators for every important result.
- Too many activity indicators. People spend time reporting effort. Correct it: count only what can be extracted automatically from existing systems.
- The same leading indicator for everyone. The agents’ example shows the link can differ from one person to another. Correct it: check the link at team level too, not only on the total.
- Result indicators over periods that are too short. In a month, two transactions more or fewer can be luck. Correct it: for rare results, use longer periods or moving averages.
Frequently asked questions
What is the difference between leading and lagging indicators?
Lagging, or result, indicators measure what has already happened: sales, transactions, accidents. Leading indicators move ahead of the result and can predict it: viewings, offers, hazards fixed in time. The first confirm whether you reached the objective, while the second leave you time to correct direction within the same period, before it is too late.
Is an activity indicator the same as a leading one?
Not always. An activity indicator counts effort, for example calls or visits. It becomes a leading indicator only if the company’s data show that its movement is followed by a movement in the result. Many easily counted activities predict nothing, and intermediate stages, such as offers received, usually predict better than raw effort.
How many leading indicators should a role have?
One or two for every important result, which usually means two to four per role. More make reporting heavier and scatter attention. It matters more that each one is verified on historical data and has a quality indicator beside it than how many appear on the scorecard or in the monthly report.
Can activity indicators go into the annual appraisal?
They can, but with caution, because they encourage visible effort instead of results. They suit weekly conversations better, and periods when the result cannot yet be measured, for example a new employee’s first months. In the end-of-period appraisal, the result should carry the most weight.
How do you find out whether an indicator really predicts the result?
Put side by side, over at least six to twelve months, the indicator’s value and the result in the following period, and see whether the ratio between them is stable. A correlation coefficient helps, but it does not prove the cause. Check across more people and watch whether the link holds once the indicator starts to count in the evaluation.
Which leading indicators exist in occupational health and safety?
Examples given by the OSHA guide: the response time to a reported hazard, unfinished corrective actions, the percentage of scheduled inspections carried out and of workers attending periodic training. The result indicators are the number and rate of injuries and illnesses. The guide recommends using leading indicators to drive change and result indicators to measure the effectiveness of the prevention programme.
What to do next
Choose a role’s main result, write down the stages that precede it and check on last year’s data which stage anticipates it best. Then:
- link the set to the company’s objectives with the article on KPIs, objectives, targets and tasks;
- for store sales, read the article on evaluating retail sales assistants;
- for reporting to senior management, see the HR dashboard template.