

 Română
 English
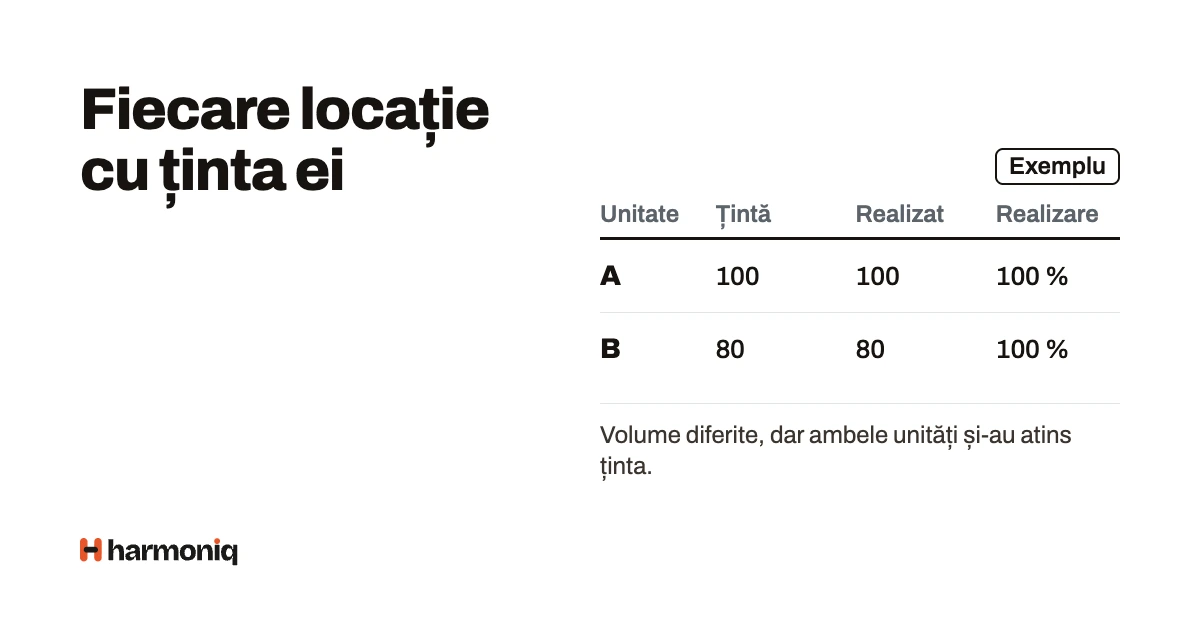
KPI targets for different locations are set from two questions: how much each location has achieved so far (its history) and how much it could achieve, given its area (its potential, estimated from footfall or floor space). A target combines the two, and the sum of the targets must cover the company’s target.
The article shows you a full calculation across four locations, including a new one with no history; a comparison between normalising per square metre and per visitor, which changes the conclusion; and the difference between an absolute and a relative target in a month when footfall falls across the whole network.
Quick answer. For different locations, start from last year’s result increased by the company’s growth rate, calculate each location’s potential from footfall or floor space and combine the two, for example 50/50. New locations get their potential, reduced for the first months. Check that the sum of the targets covers the company’s target and write the rules down before the period.
Definitions: target, normalisation, potential
- The absolute target is a fixed value for a period: “451,500 lei in November”.
- The relative target is a position against a benchmark: “at least the network average” or “in the top three locations”. The benchmark is calculated after the period ends.
- Normalisation means relating a result to a quantity that differs between locations and that the team does not control: floor space, the number of visitors, opening hours.
- Potential is what the location would achieve if it worked at the network’s average level, given the normalising quantity: visitors × the network’s average sales per visitor.
- Like-for-like means calculated only for the locations open in both periods compared, so that a new opening does not inflate the growth.
Why a single target does not work
A 5% increase asked of everyone looks fair, but it assumes that every location was equally far from its potential last year. A location that did very well gets the same increase as one that had an incomplete team. The first has less room to grow, the second more.
Targets that follow only past results also affect behaviour. A study of retail store managers found that those with good results in the first three quarters cut back their selling effort in the last quarter, and that those who did so were more likely to reach the next year’s target, calculated from current sales (Bouwens and Kroos, Journal of Accounting and Economics, 2011). The phenomenon is called the ratchet effect.
Four ways to set a location’s target
| Method | How it is calculated | When it fits | The main risk |
|---|---|---|---|
| History + growth | Last year’s actual × (1 + the company’s growth) | Stable locations, with at least a year of history | Penalises good locations, encourages holding back sales |
| Potential from footfall | Visitors × the network’s average sales per visitor × (1 + growth) | There is a reliable visitor count | Ignores the real differences in clientele between areas |
| Potential from floor space | Square metres × the network’s average sales per square metre × (1 + growth) | There are no footfall data; the formats are similar | Treats a crowded floor and an empty one the same |
| Combined | For example, 50% history + 50% potential | Networks with locations of different ages and areas | The weighting between the two is a choice, not a certainty |
A worked example across four locations
Hypothetical example. A fictitious network of four stores. The company’s target for November: like-for-like sales +5% on November last year. Every figure can be redone with a calculator.
| Location | Sales in November last year | Visitors | Floor space | Lei per visitor | Lei per m² |
|---|---|---|---|---|---|
| L1 Centre | 600,000 | 30,000 | 250 m² | 20.00 | 2,400 |
| L2 Neighbourhood | 300,000 | 12,000 | 150 m² | 25.00 | 2,000 |
| L3 Mall | 400,000 | 23,000 | 200 m² | 17.39 | 2,000 |
| L4 New (opened this year) | — | 10,000 (estimated from the months open) | 120 m² | — | — |
| The like-for-like network (L1–L3) | 1,300,000 | 65,000 | 600 m² | 20.00 | 2,167 |
The normalisation chosen changes the conclusion
Per square metre, L2 and L3 look identical: 2,000 lei/m² each. Per visitor, they are very different: L2 sells 25 lei for every visitor, L3 only 17.39. L3 has plenty of footfall and turns it into sales poorly; L2 has little footfall and turns it into sales very well. Normalising by floor space would give these two locations the same target and hide L3’s conversion problem.
The targets under each method
History + growth: last year’s sales × 1.05. Potential: visitors × 20 lei × 1.05 = visitors × 21 lei. Combined: the average of the two. For L4, with no history, the combined target is the potential reduced to 80% for the first months (a start-up rule chosen for the example; each company sets its own).
| Location | A. History + 5% | B. Potential from footfall | C. Combined 50/50 | C against last year |
|---|---|---|---|---|
| L1 Centre | 630,000 | 30,000 × 21 = 630,000 | 630,000 | +5.0% |
| L2 Neighbourhood | 315,000 | 12,000 × 21 = 252,000 | 283,500 | −5.5% |
| L3 Mall | 420,000 | 23,000 × 21 = 483,000 | 451,500 | +12.9% |
| L4 New | — | 10,000 × 21 = 210,000 | 210,000 × 80% = 168,000 | — |
| Total L1–L3 | 1,365,000 | 1,365,000 | 1,365,000 | +5.0% |
The sum of the like-for-like targets (L1–L3) is 1,365,000 lei, exactly 1,300,000 × 1.05: it covers the company’s target. L4 comes on top, with 168,000 lei, and the network has 1,533,000 lei to achieve in all.
Three things to discuss before communicating
- L2 gets a target below last year. The method “rewards” it for having exceeded its potential. If your rule says no location goes below last year, L2 gets 300,000, and the extra 16,500 lei are taken from another, for example from L3, which reaches 435,000 (+8.8%).
- L3 would get +20.75% on potential alone. 483,000 ÷ 400,000 = 1.2075. Such a target calls for a change in conversion, not just effort. Locke and Latham show that difficult goals raise performance only as long as people remain committed to them, and that a bonus paid only on reaching a very difficult goal can lower the performance of those who see they will not get it (American Psychologist, 2002).
- L4 does not have a year of data yet. The footfall estimate from the first months includes the opening effect. Review the target after three months, under a rule announced in advance.
Absolute targets or relative targets
The absolute target says “how much”; the relative target says “compared with the others”. The difference shows in a month with a common shock, for example a fall in footfall across the whole network because of the weather.
Hypothetical example. In November, footfall falls by about 10% across the whole network. The targets are the combined ones (C). Relative index = the location’s achievement ÷ the network’s achievement × 100.
| Location | Target | Actual | Absolute achievement | Relative index |
|---|---|---|---|---|
| L1 Centre | 630,000 | 576,000 | 91.4% | 101.1 |
| L2 Neighbourhood | 283,500 | 260,000 | 91.7% | 101.4 |
| L3 Mall | 451,500 | 400,000 | 88.6% | 98.0 |
| L4 New | 168,000 | 150,000 | 89.3% | 98.8 |
| The network | 1,533,000 | 1,386,000 | 90.4% | 100.0 |
In absolute terms, no location reached its target. In relative terms, L1 and L2 did better than the network, and L3 and L4 worse. The relative target protects people from common shocks, but it has a cost: a location can be “above average” in a bad month for the company, and in a small network a single result moves the average.
A third option is a target normalised by the uncontrolled factor. If L1’s target is expressed as 630,000 ÷ 30,000 = 21 lei per visitor, the month with 27,000 visitors and 576,000 lei gives 21.33 lei per visitor: 101.6% of target. A per-visitor target fits only if the visitor count is reliable and cannot be influenced by the team.
How to set targets by location, step by step
- Fix the company’s target for the like-for-like locations and separately for openings.
- Choose the normaliser: the factor that differs between locations and that the team does not control (footfall, floor space, opening hours). Check that its data are reliable.
- Calculate each location’s history. To reduce the ratchet effect, use the average of the last two or three comparable periods, not just the last one.
- Calculate the potential: the normaliser × the network’s average rate × (1 + growth).
- Combine history and potential by a weighting chosen in advance and apply the protection rules (no fall below last year, a maximum increase, the rule for new locations).
- Reconcile: the sum of the like-for-like targets must cover the company’s target. Adjust the locations with the largest gap between history and potential, not all of them equally.
- Test on past periods how the results would have been distributed with the new targets, before tying them to bonuses. The method is described in the article on testing a KPI scorecard.
- Communicate to each location its target, how it was calculated and when it is reviewed.
Practical tip. Show the three figures for each location: the history, the potential and the final target. A manager who sees that their area’s potential is higher than their result understands the target more easily than one who receives only a figure.
Common mistakes
- The same increase for everyone. Correct it: combine each location’s history with its potential.
- Targets that do not add up to the company’s target. If the sum of the targets is below the company’s target, every location can reach its target without the company reaching its objective. Correct it: reconcile before communicating.
- Normalising by a factor the team controls. Sales per employee can be “improved” by working with fewer people, at the customers’ expense. Correct it: normalise by factors the location does not control.
- The new location compared with the old ones from the first month. Correct it: a written start-up rule and a scheduled review.
- The target changed during the period. Correct it: changes apply to the next period; an exceptional event (a refurbishment, a temporary closure) is handled under an announced rule.
- Volume targets only. A very high sales target pushes towards discounts or pushy selling. Correct it: put a quality indicator beside it, as in the article on KPIs that encourage the wrong behaviour.
How to do this in Harmoniq
In Harmoniq, a metric can have values for each person or for each unit. Each location’s target becomes a separate “plan” metric, with one value per unit, entered by hand or imported from Excel or CSV, where the unit is recognised by its code or name.
- The unit’s scorecard (“Each unit”) uses the scoring method “Achieved compared with planned (%)”: the unit’s result divided by its plan. An employee’s scorecard can read the same value for the unit they work in.
- History in the formula: in a formula of your own (Professional and Enterprise), the pieces “The previous period”, “Average of the last periods” and “Growth on the previous period” write the calculation for you.
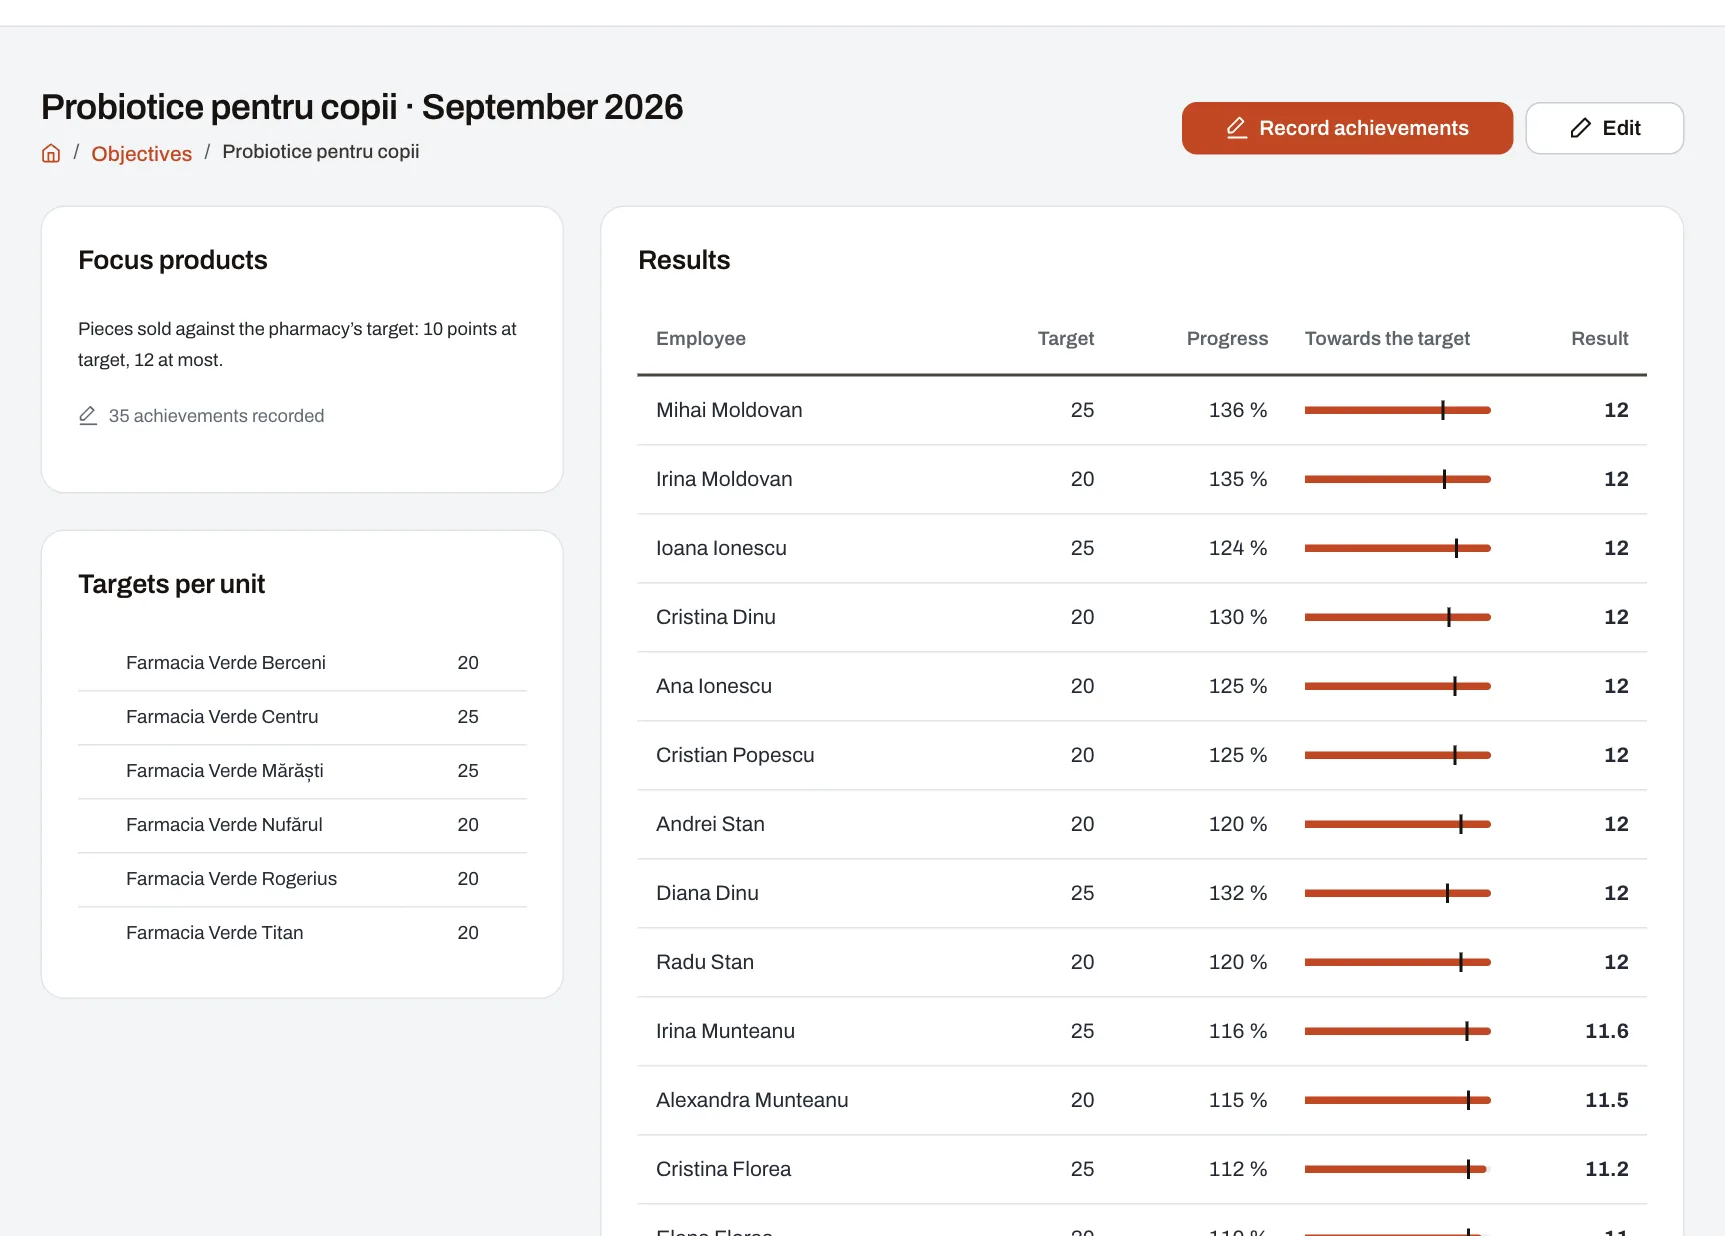
- The month’s objectives (focus products, campaigns) have a target for each unit; results are scored automatically at the month’s close, under scoring rules built in Professional and Enterprise.
- The simulation shows how the scores would have been spread across the levels in a period already closed, without saving anything.
Frequently asked questions
How do you set different sales targets for different stores?
Combine each store’s history, increased by the company’s growth rate, with its potential, calculated from footfall or floor space at the network’s average level. A 50/50 weighting is a starting point, not a rule. Then check that the sum of the targets covers the company’s target and test the result on past periods before tying it to bonuses.
What is target normalisation?
Normalisation means relating the result to a factor that differs between locations and that the team does not control: floor space, the number of visitors or opening hours. This makes locations of different sizes comparable. The choice of factor changes the conclusion: two stores identical per square metre can be very different per visitor.
What target does a new location with no history get?
It gets the potential calculated from footfall or floor space, usually reduced for the first months by a start-up rule, for example 80%. Footfall in the first months includes the curiosity of the opening, so the estimate is fragile. Schedule a review after three months and announce the rule in advance, so the team knows when and how the target changes.
When are relative targets better than absolute ones?
Relative targets are better when results depend heavily on common factors nobody controls, such as the weather, a general market downturn or a central campaign. They compare the locations with one another. They have limits too: in a small network, the average moves with every result, and a location can be above average in a bad month for the company.
Is it normal for a location to get a target below last year?
It can happen when the location has far exceeded the potential calculated for its area. It is a management decision: you can accept the decrease or apply a protection rule under which no target goes below last year’s result. What matters is that the rule is written before the calculation, not chosen after the figures are known.
How do you stop managers holding back sales to keep their target low?
Do not calculate the next target from the last period alone. Use the average of two or three comparable periods, combine history with potential and announce the rule in advance. A study of store managers found exactly this behaviour when the next target depended on current sales: after good results in the first three quarters, managers cut back their selling effort in the last one.
What to do next
Take last year’s data for your locations and redo the table above, with the three target options side by side. Then:
- choose the indicators that go beside the sales target with the guide to KPI indicators;
- tie the targets to bonuses following the article on thresholds for performance bonuses;
- see objectives with targets by unit and calculated scores in the demo company.